
Tableau is a visual analytics platform that lets people connect to data, explore it by dragging and dropping fields, and build interactive charts and dashboards without writing code. It is used by analysts and business teams to answer questions quickly, spot patterns and share findings with colleagues. This guide explains what Tableau is, its main products, how data flows from a connection to a published dashboard, the key concepts such as dimensions, measures and calculated fields, a sample calculation, how Tableau compares with Power BI and other tools, and how to design dashboards that people actually use.
Short answer: Tableau connects to your data, lets you build views by dragging fields onto a canvas, combines views into dashboards and publishes them on Tableau Server or Tableau Cloud. It is known for flexible, high-quality visual exploration.
What is Tableau?
Tableau began at Stanford University as a research project into making data visualisation more intuitive, and it became one of the best-known business intelligence products. It is now owned by Salesforce. The central idea is visual analysis: instead of writing queries and waiting for a report, you interact directly with the data and see the answer change as you ask follow-up questions.
It belongs to the category we describe in our guide to business intelligence, and it relies on the data foundations in our data analytics overview. As with every BI tool, the quality of the output depends on the quality and structure of the underlying data.
The Tableau product family
| Product | What it is | Used for |
|---|---|---|
| Tableau Desktop | The authoring application | Connecting to data and building worksheets and dashboards |
| Tableau Prep | A data preparation tool | Cleaning, combining and reshaping data visually |
| Tableau Server | Self-hosted sharing platform | Publishing and governing content inside your own infrastructure |
| Tableau Cloud | Hosted sharing platform | Publishing and collaboration without running servers |
| Tableau Public | A free public gallery | Sharing visualisations openly; never for private data |
| Tableau Mobile | Apps for phones and tablets | Viewing dashboards on the move |
Product names and packaging change over time, so check Tableau's current documentation for licences and editions.
How Tableau works: from data to dashboard
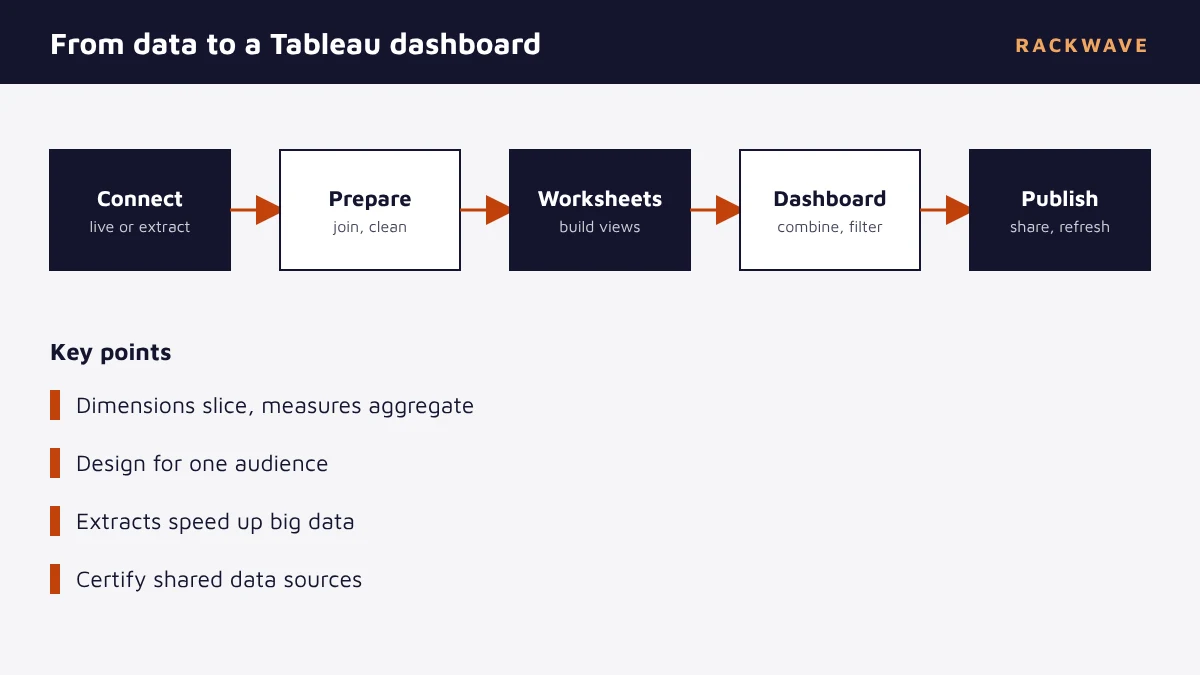
- Connect to data. Choose from files, databases, cloud warehouses and applications. Decide between a live connection and an extract, which is a compressed snapshot that is fast to query.
- Prepare the data. Join and union tables, fix data types and clean fields, either in the data source pane or in Tableau Prep.
- Build worksheets. Drag fields onto rows, columns and the marks card to create each chart, with filters and colour.
- Assemble a dashboard. Combine worksheets, add filters, actions and layout so that clicking one chart updates the others.
- Publish and share. Publish to Tableau Server or Cloud, set permissions and schedule extract refreshes.
- Maintain. Monitor usage and performance, certify trusted data sources and retire unused content.
Key Tableau concepts
| Concept | Meaning | Example |
|---|---|---|
| Dimension | A categorical field used to slice data | Region, product, customer segment |
| Measure | A numeric field that is aggregated | Sales, quantity, profit |
| Discrete and continuous | Blue fields create headers; green fields create axes | Month as a label vs a time axis |
| Worksheet | A single view or chart | Sales by region |
| Dashboard | A collection of worksheets with interactivity | A sales overview page |
| Story | An ordered sequence of views | A narrative for a presentation |
| Extract | A saved, compressed copy of data | A nightly snapshot of orders |
| LOD expression | A calculation at a specified level of detail | Customer's first order date |
Calculated fields and level of detail
Calculated fields let you derive new values. Level of detail expressions let you calculate at one grain and use the result at another, which is a common need. The examples below show a ratio and a customer-level calculation.
// Profit ratio
SUM([Profit]) / SUM([Sales])

// Each customer's first order date (LOD), usable in any view
{ FIXED [Customer ID] : MIN([Order Date]) }

// Flag large orders
IF [Sales] > 5000 THEN "Large" ELSE "Standard" END
Use the ratio as a calculation on aggregated values rather than averaging row-level ratios, which gives wrong answers. This kind of detail is where an experienced analyst saves a team from misleading numbers.
A good dashboard answers the next question before the user thinks to ask it, and then gets out of the way.
Designing dashboards that work
- Start with the audience and the decision. A dashboard for executives differs from one for analysts.
- Show the headline first. Put the key number or trend where the eye lands first.
- Use the right chart. Lines for trends, bars for comparisons, tables for exact values.
- Limit colours. Use colour to highlight, not to decorate, and consider colour-blind viewers.
- Add interactivity with purpose. Filters and highlight actions should help answer real questions.
- Keep it fast. Fewer sheets, simpler calculations and extracts for big data.
- Label clearly. Titles should state what the chart shows, and units should be visible.
Tableau vs Power BI
| Area | Tableau | Power BI |
|---|---|---|
| Core strength | Flexible, polished visual exploration | Tight Microsoft integration and broad reach |
| Modelling | Relationships and data source joins, LOD expressions | Semantic model with DAX measures |
| Ecosystem | Salesforce and many data sources | Microsoft 365, Azure and Dynamics 365 |
| Ease of start | Intuitive for visual analysts | Familiar to Excel users |
| Sharing | Tableau Server or Cloud | Power BI service |
Neither is universally better. If your organisation lives in Microsoft 365, Power BI may be the natural choice. If your analysts value visual flexibility, or your data sits in Salesforce, Tableau is a strong candidate. Many large organisations use both, with clear guidance on which tool fits which job.
Tableau and Salesforce
Because both products belong to the same family, Tableau connects well to Salesforce data, and Salesforce has embedded analytics features that build on it. If you report on pipeline, service cases or campaign results, see how the built-in tools compare in our guides to Salesforce reports and Salesforce dashboards. Use native reports for operational lists inside the CRM, and Tableau when you must combine CRM data with finance, product or marketing sources. Our Salesforce services team can help decide where each belongs.
Data foundations for Tableau
Tableau is the visible tip of a larger system. Behind every good dashboard sits a pipeline that gathers, cleans and models data. If your data lives in many systems, build a consistent layer first, using a data warehouse and well-designed data pipelines. Our data analytics service and data warehousing service build these foundations, and our data governance service agrees definitions so everyone means the same thing by revenue or active customer.
Performance and governance tips
- Use extracts for large or slow data sources and schedule their refresh.
- Filter at the data source and limit the number of rows and columns you bring in.
- Reduce the number of worksheets and quick filters on a dashboard.
- Prefer simple calculations and avoid heavy table calculations on big views.
- Publish certified data sources so people reuse trusted definitions.
- Apply permissions by project and group, and use row-level security where needed.
- Review usage and remove dashboards no one opens.
Getting started with Tableau
- Choose a question. For example, which regions are losing margin, and why?
- Connect a clean data source. Start with one well-understood table or view.
- Build three or four views. Test them with the people who will use them.
- Combine into a dashboard. Add filters and actions, then simplify.
- Publish with the right access. Set permissions and refresh schedules.
- Gather feedback. Improve what people use and drop what they do not.
Key takeaways
- Tableau is a visual analytics platform for exploring data and sharing interactive dashboards.
- Desktop builds content, Prep cleans data and Server or Cloud shares it.
- Dimensions slice data and measures are aggregated; LOD expressions control calculation grain.
- Design for a specific audience and decision, keep dashboards fast and limit colour.
- Strong dashboards depend on strong data pipelines and agreed definitions.
Quick glossary
| Term | Meaning |
|---|---|
| Dimension | A categorical field used to group data |
| Measure | A numeric field that is aggregated |
| Extract | A compressed snapshot of data |
| LOD expression | A calculation at a specified level of detail |
| Worksheet | A single chart or view |
Read next: What Is NoSQL? Types, Examples and When to Use It · What Is Data Visualization? Chart Types and Best Practice · What Is a Database? Types, Concepts and How to Choose
Frequently asked questions
What is Tableau used for?
Tableau is used to connect to data, explore it visually and build interactive charts and dashboards that help teams understand performance, spot trends and make decisions, across areas such as sales, finance, operations and marketing.
Is Tableau a BI tool?
Yes. Tableau is a business intelligence and visual analytics platform that supports data exploration, dashboards and sharing, with products for authoring, data preparation and hosted or self-hosted publishing.
What is the difference between Tableau and Power BI?
Tableau is known for flexible visual exploration, and Power BI for tight integration with Microsoft products and broad adoption. Both build interactive dashboards, and the better choice depends on your ecosystem, skills and use cases.
What are dimensions and measures in Tableau?
Dimensions are categorical fields such as region or product used to group data. Measures are numeric fields such as sales or profit that are aggregated. Tableau treats them differently when building views.
What is a Tableau extract?
An extract is a compressed snapshot of your data stored in Tableau's format. It is fast to query and can be refreshed on a schedule, which suits large or slow data sources.
Do I need to code to use Tableau?
No. You can build many views by dragging and dropping fields. Calculated fields and level of detail expressions use a formula language that helps with more advanced analysis.
Can Tableau connect to Salesforce?
Yes. Tableau includes connectors for Salesforce and many other sources, so you can combine CRM data with finance, product and marketing data in one analysis.
How do I make a Tableau dashboard faster?
Use extracts, filter at the source, reduce the number of sheets and filters, simplify calculations, limit the data you bring in and review slow views with the performance recorder.